Welcome to the first day of our 10 Days to a Healthier Website series, designed to help you kick off 2026 with an easy, no-nonsense, guide to looking at some key aspects of your current website and marketing.
Measuring your site's speed
Today we're starting off really easily - we're going to look at your site's speed. Our insights have covered in the past how important page speed is for search engine rankings so we won't rehash that here. Instead, fire up your web browser of choice and point it at Google's Page Speed Insights. When you're there, pop your site's address in the box, hit the big blue "Analyze" button, and sip your cup of tea for about 20 seconds.
Once the results are loaded, you should see something akin to the screenshot below :
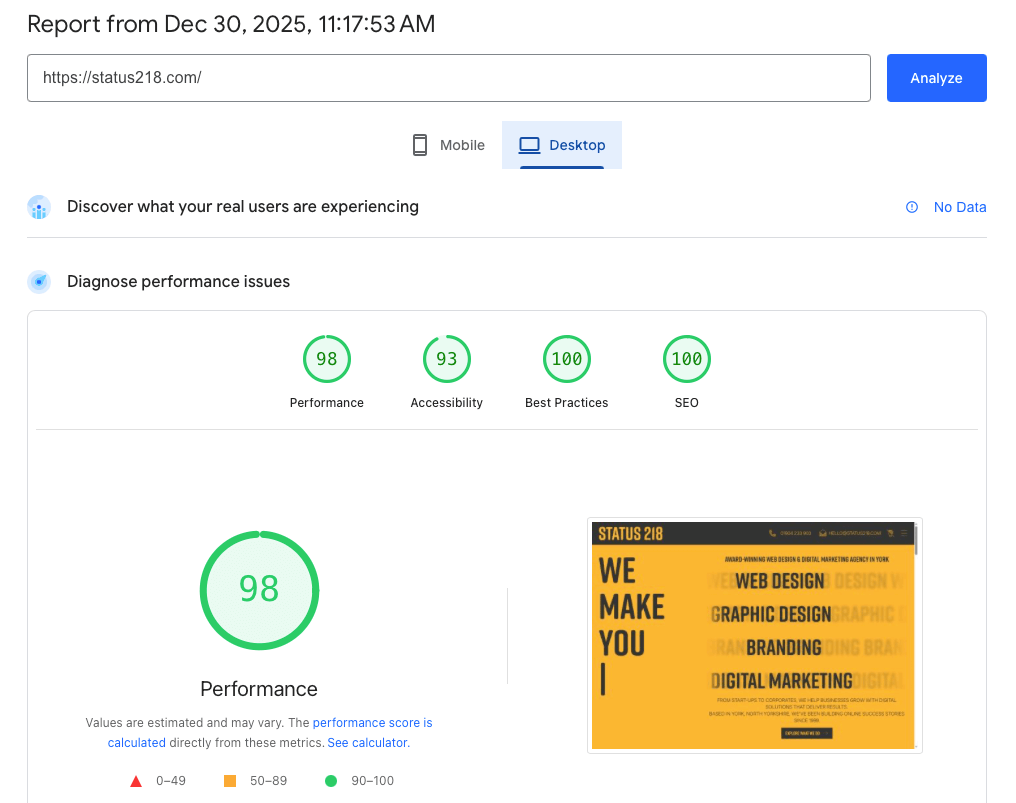
The first thing to note is that there are two separate sets of results, one for performance on mobile, and one for performance on desktop. Your site's performance on mobile will almost always be significantly lower than on desktop - that's because Google automatically 'throttles' the speed to make the site behave as though it's being accessed from a mobile on a 4G network. So the figures may be artificially lower than in reality.
The second thing to note is that the "Discover what your real users are experiencing" section at the top may show "No Data", as in the screenshot, unless your site receives a significant amount of traffic. That's not a massive problem, so if no data is shown, don't worry about it too much.
What the headline stats mean
Looking at the results on the desktop tab first, the four key metrics are (i) performance - how fast and cleanly your site loads, (ii) accessibility - how well your site caters for those with special needs, (iii) best practices - which is a bit of a catch-all for how up to date the site is, and finally (iv) SEO - how well your site is structured from an SEO point of view.
Ideally, you want all the four to be green, but a yellow (particularly in the best practices section) isn't automatically bad news.
Performance
Scrolling down a bit, ideally you're looking for lots of green numbers, as in the example screenshot below :
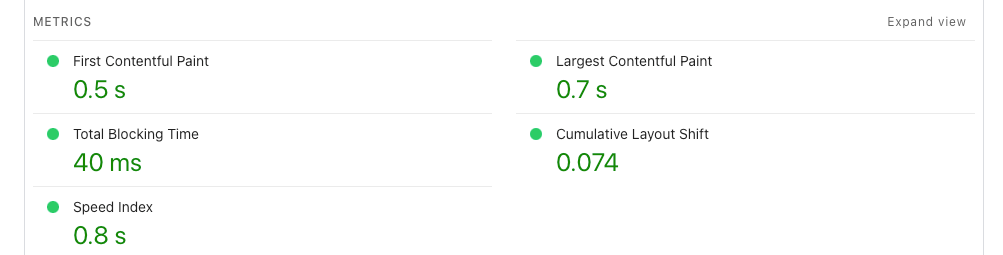
The First Contentful Paint is how long take for any content to show on the page. The Largest Contentful Paint is how long the biggest visible element takes to load (this is usually the main content). The Speed Index is how quickly the entire page becomes visually complete. The Total Blocking Time is a measure of how much time Javascript blocks the main loadin gthread and prevents users from interacting with the page, and the Cumulative Layout Shift is a measure of how much the page shifts around whilst loading.
The first three of these are the core Web Vitals which Google weights heavily for rankings. But that's not to say that the others - in particular Cumulative Layout Shift - aren't important. If you've ever gone to click a button or link whilst a page is loading and it's moved down the page so you end up missing it or - worse - clicking something else, then that's Cumulative Layout Shift in action. Since we covered it in much more detail in this blog post we won't go into more detail about it here, save to say that if it's quite high on your site, it needs to be addressed.
If you only look at one thing in this section, make it the Speed Index - anything in orange is bad news, and anything in red is terrible news - get in touch with us if you see concerning numbers and want a second opinion.
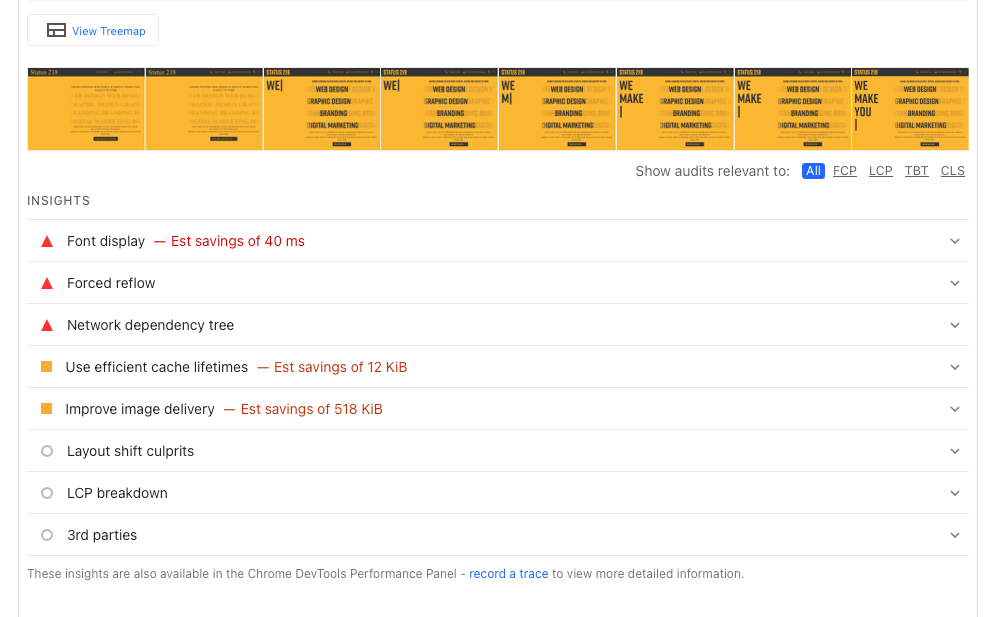
Below the metrics there's a slideshow of images of the page as it loads, along with an Insights section which will provide a long list of suggestions on how to improve the page speed times. Some of these will be outside your control, but if you see significant estimated savings alongside the "Improve image delivery" section, then that's definitely something to address.
Accessibility
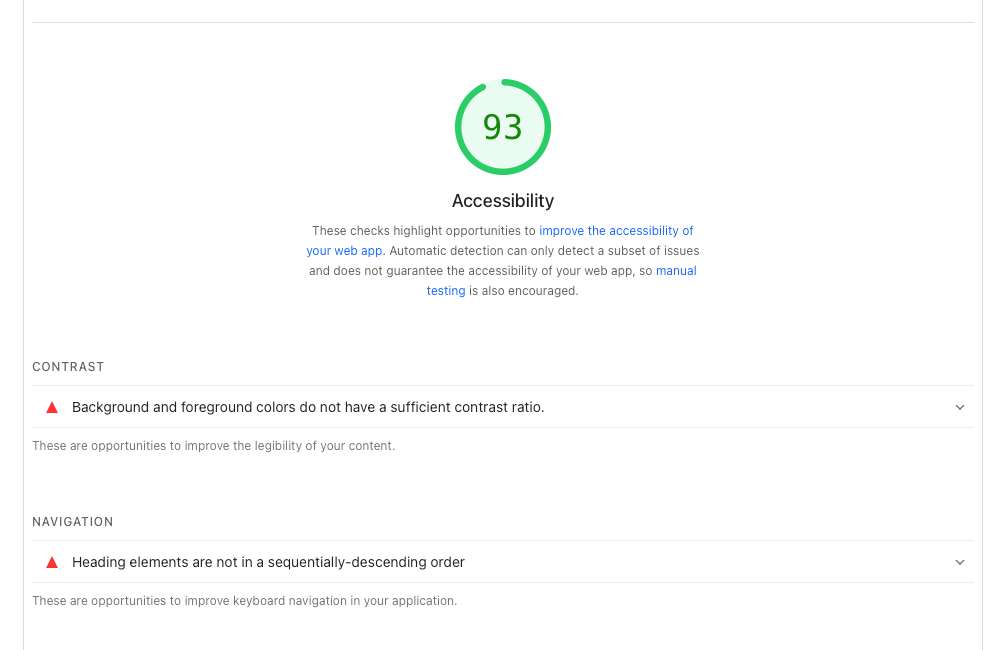
The Accessibility section looks at whether there are issues preventing the site from being fully accessible to those who use screen readers, assistive devices, or high zoom levels to view your website - we're going to look at accessibility in more detail later on in this series, so at this point, if you're in the green, well done, and if you're in the orange, we'll look at why a little further down the line.
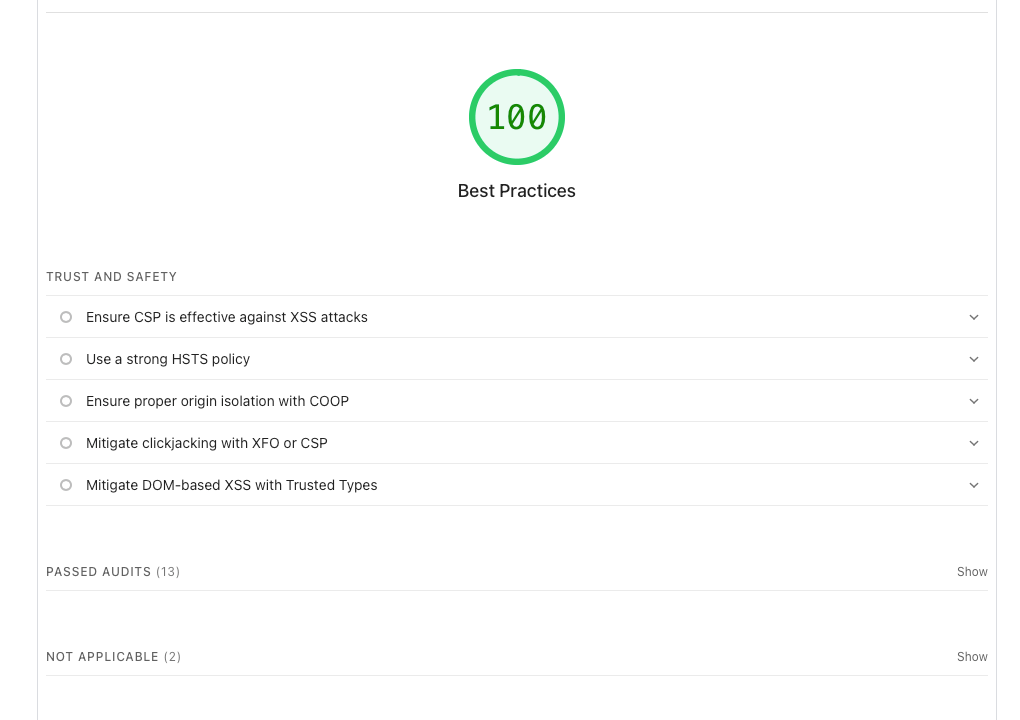
Best practices
This section can be quite obtuse, for the non-technically minded, and even one or two small issues (which may well not impact on how your users experience your site) can result in a significant drop.
Broadly speaking, again, if you're in the green or high yellows (60+) then don't worry too much about it. But if it's red, then it's definitely something that should be looked at.
SEO
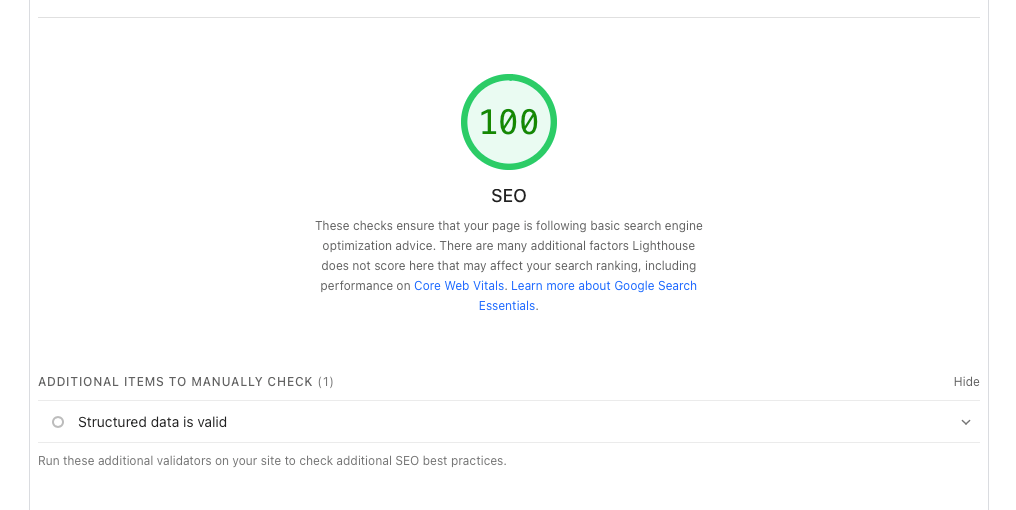
This is not an area in which the Page Speed Test tool excels, as it's a little bit too general - it's looking at the structure of the site, and any rich snippets. So take any measurement here with a little pinch of salt. Ideally you're looking for rich results to be found (we've covered these in more detail in a blog post you can read here and will be covering them in more detail latere in this series).
Mobile
A mentioned above, the mobile tab will probably show slightly worse results than the desktop tab because of the throttling imposed on it. But certain issues (like Cumulative Layout Shift) will be accented on mobile, because the impact of one image that loads, shifting content below it down, will be greater on mobile than on desktop.
But broadly-speaking, there is a large degree of crossover - take care of issues like oversized images, layout shift, and server response time, on desktop, and the impact will filter through to the mobile results as well. Just don't expect to see 100 across the board here - it's possible, but you'll be chasing the long tail to get to it.
Conclusions
In amongst the technical cruft that it shows you, the Page Speed Tool does well to highlight the big-picture issues, giving you an immediate oversight of how fast your site is. We cannot overstate how important speed is to your site performing well in the search engines - but there are a huge range of factors (hosting, content, technical configuration) that go into it, all with varying degrees of importance. And we understand that that can be confusing to the non-technically minded. That's why we're always happy to take a look at your site, its performance, and have a chat - with no obligation on your part whatsoever - to see if we can improve things for you, so feel free to get in touch if you're looking to boost your site's performance.
If you want to understand why page speed matters so much, we covered that in detail in How Important Is Page Speed for Search Engine Rankings?
Ready for the next step? Head to Day 2: The Importance of a robots.txt.