With the rise in traffic coming from responses given by AI platforms such as Claude, ChatGPT and Gemini, the term GEO is on the rise - generative engine optimisation is the latest iteration of search engine optimisation, whose proponents advocate writing for the benefit of AI readership.
Whilst the consensus is generally split - those in favour of addressing GEO argue that it's the all-shiny new kid on the block, whilst those who are against addressing it specifically argue that it doesn't involve doing anything that you aren't doing - or should be doing - already anyway, there's no doubt that referrals from such platforms are on the increase, and as with things that are worth monitoring, the first step of analysing anything is to measure it.
In this post we look at how to measure the amount of traffic that comes from such sources, in both Google Analytics and Google's Looker Studio.
You have got Google Analytics set up on your site, haven't you? If not, read about the benefits of it in our recent blog post.
In Google Analytics
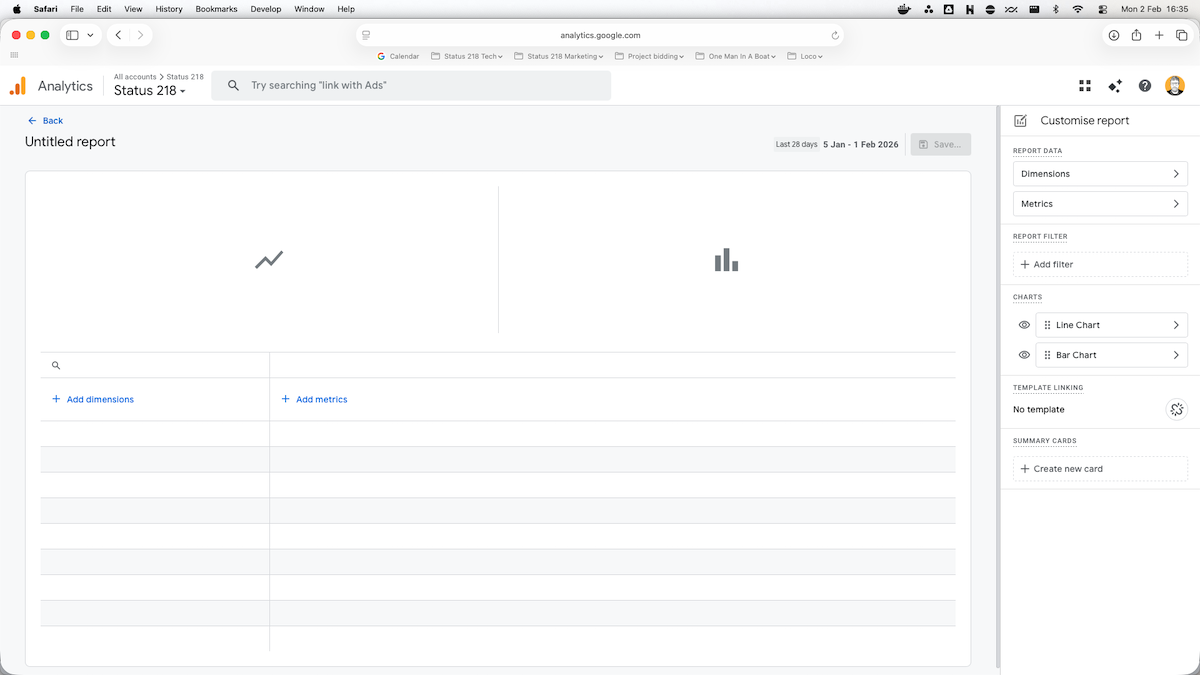
Whilst it is possible to filter an existing report, it is probably more sensible to create a custom report. Within the Reports section of Google Analytics, visit your Library from the bottom of the sidebar, and under the Reports section click on Create new report, then Create detail report and then on Blank. You will be presented with a screen like the below :
Add and apply one dimension : Session source.
Then add and apply whatever metrics you may want - as long as you include sessions in them - average engagement time per session, total revenue (if you measure revenue) - it's up to you.
Applying those will give you a line chart and a bar graph of all session sources, so the final step is to filter the session sources so that it only shows ones from AI platforms. To do this, under the Filter section, click Add Filter. The dimension to filter is Session source, the match type is Matches regex and for the value, copy and paste the below :
(chatgpt|openai|anthropic|deepseek|grok)\.com|(gemini|bard)\.google\.com|(perplexity|claude)\.ai|(copilot\.microsoft|edgeservices\.bing)\.com|edge\scopilotYou may then wish to hide the line chart (which will be there as default) and just concentrate on overall numbers, rather than a day-by-day breakdown.
And there you are - for a given date range you know at a glance how much traffic is coming from AI responses.
In Google Looker Studio
Assuming you have already plugged Google Analytics into Looker Studio as a data source, you already have the key bit of information above, which teaches you how to filter by the relevant user agent.
On your chosen report screen, click Edit, and then click Add a chart - in this case, we want a table. Click to place it whereabouts in your report you want it (you can always edit this later).
Then, on the right hand side of the screen, you'll see the bars to set up the chart. Your data source will want to be your Google Analytics property (if you've already set up Looker Studio you'll probably already have this configured as a data source).
As with Analytics, you then need to configure the Dimension - this is going to be Session source. The metric will be Sessions. In the Filters section, click to add a new Filter, and as above, this will Include where Session Source is a RegExp Match, and then paste the same list of matches from the example above.
Save and apply the filter, and your chart should immediately update to show you a horizontal bar chart with the sessions coming in from AI platforms.
And that's it - if nothing else, you can monitor the change over time and see if it reflects what you see with any SEO activity that you may be doing anyway.
If you want to pull your Analytics data into a single, easy-to-read dashboard, we covered how to do exactly that in Pull All Your Data Into One Place with Google Looker Studio.
For a broader introduction to what Google Analytics can do for your business, see Master Google Analytics: Essential Insights for SMBs.
Our work : SEO & Marketing
Key Takeaways
What is GEO and how does it relate to AI traffic monitoring?
GEO stands for Generative Engine Optimisation, which is the latest iteration of search engine optimisation. It focuses on writing content for the benefit of AI readership. With increasing traffic coming from AI platforms like Claude, ChatGPT, and Gemini, monitoring this traffic has become important for understanding your website's reach.
How do I create a custom report in Google Analytics to track AI platform traffic?
In Google Analytics, go to the Reports section, visit your Library, and create a new blank detail report. Add 'Session source' as a dimension and include metrics like sessions and average engagement time. Then add a filter using 'Session source' with 'Matches regex' and use the regex pattern that includes chatgpt, openai, anthropic, deepseek, grok, gemini, bard, perplexity, claude, copilot, and edge services domains.
How can I visualize AI traffic in Google Looker Studio?
In Looker Studio, click Edit on your report screen and add a table chart. Set your Google Analytics property as the data source, configure 'Session source' as the dimension and 'Sessions' as the metric. Add a filter to include where Session Source matches the RegExp pattern for AI platforms. Save and apply the filter to see a horizontal bar chart showing sessions from AI platforms.
RELATED INSIGHTS
"You're £6 away from free delivery"
You'll have seen it a hundred times - we look at the numbers behind the nudges
What makes a hospitality website great
The formula isn't complicated, but many hospitality websites get it dramatically wrong. Get it right and your website will flourish.
Pull all your data into one place with Google Looker Studio
We're recent, but absolute, converts to Looker Studio - here's why you should be using it too.